Hisen's Blog
思考,学术,飞行。
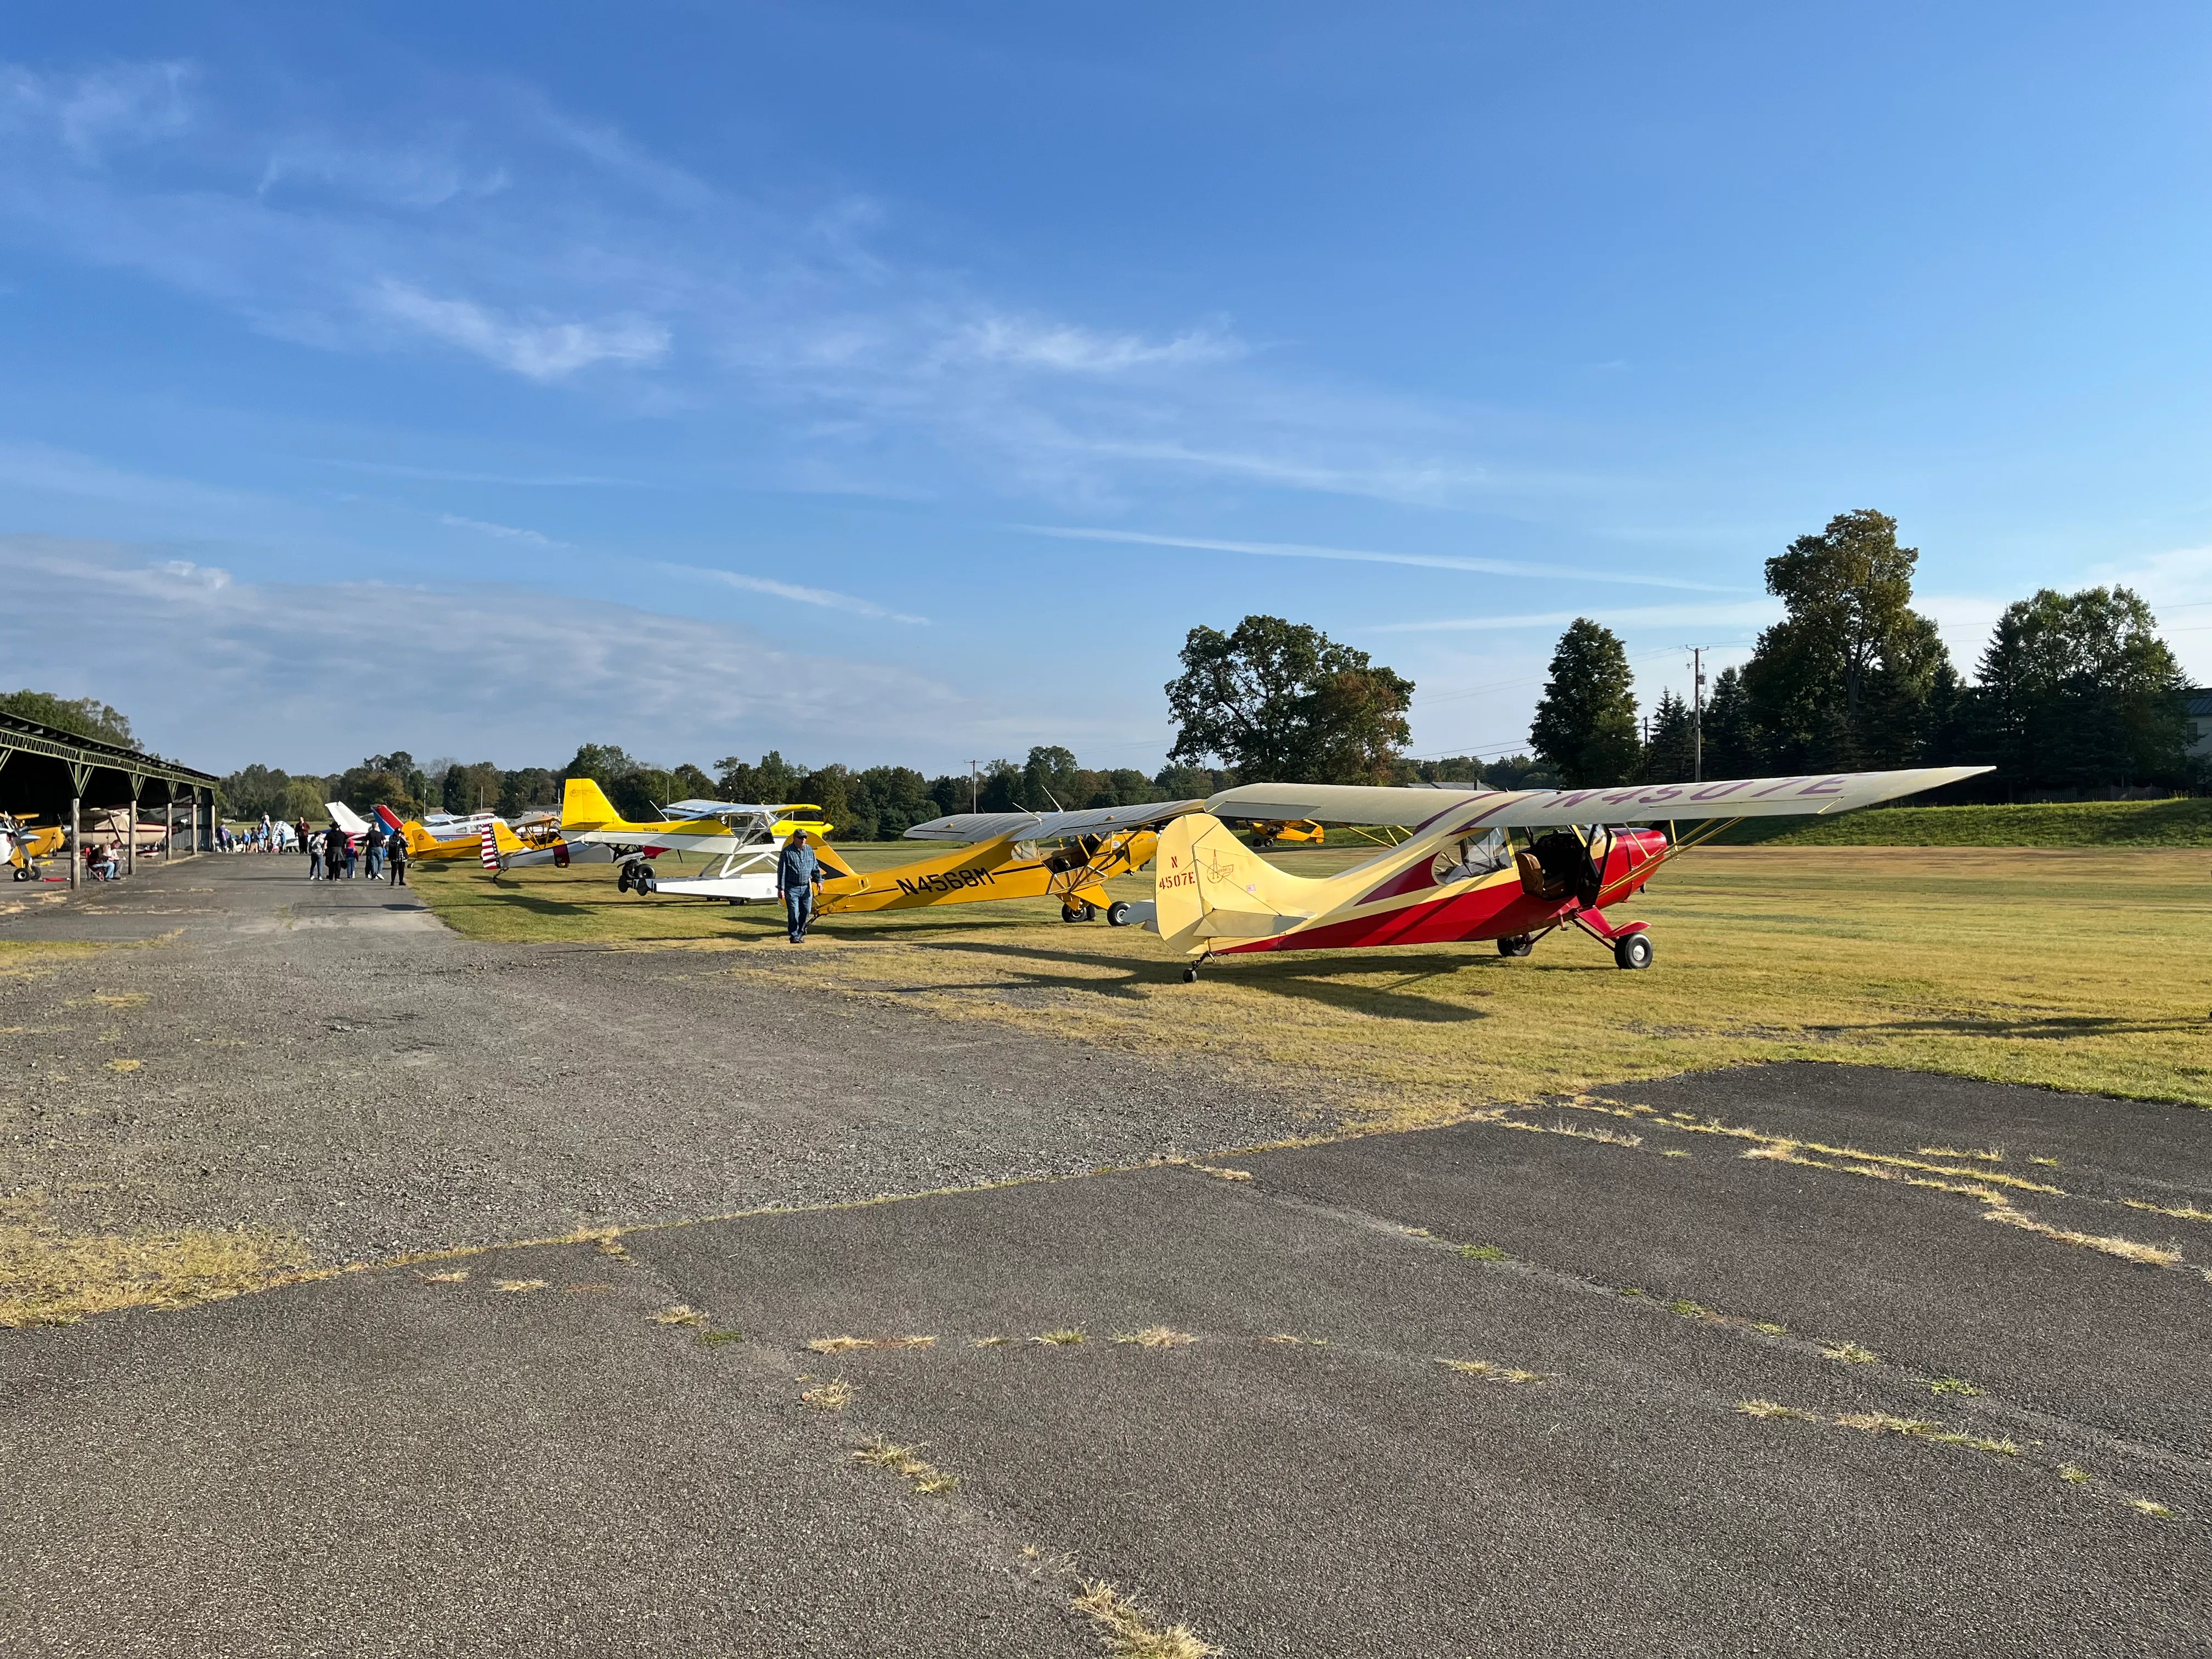
你是否准备好学飞了?
15 Jan 2026
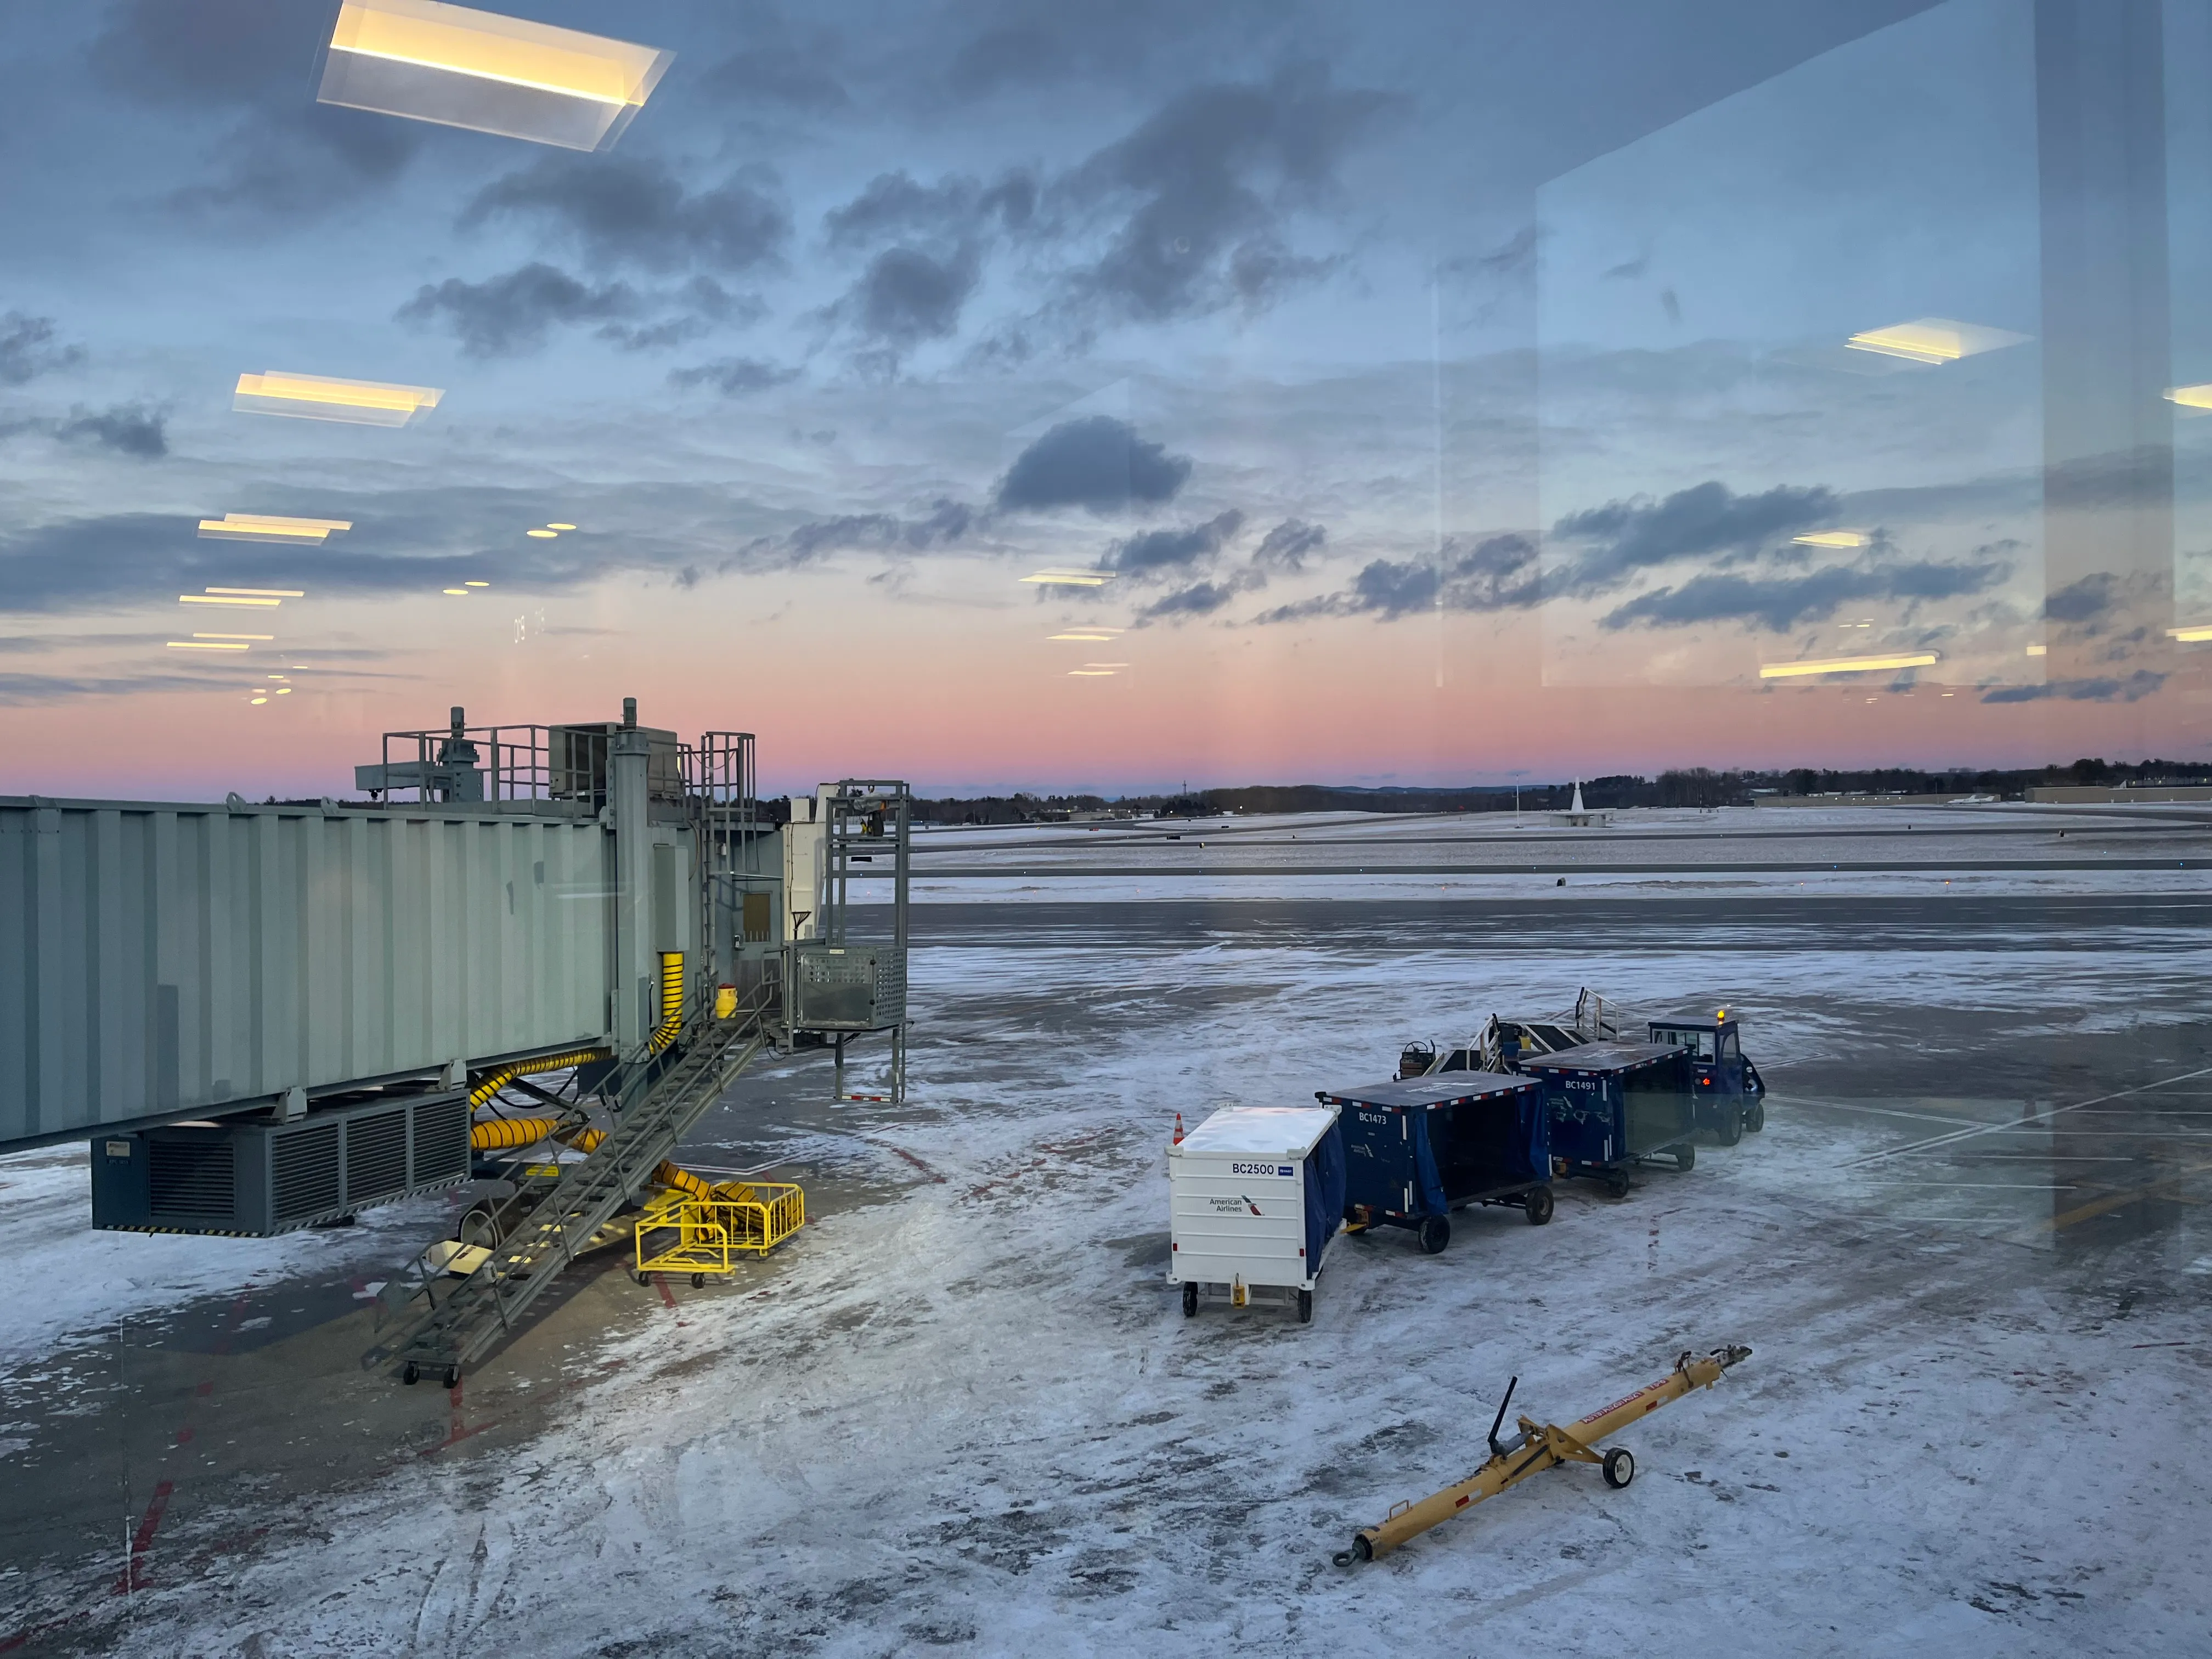
回国前需要办的二三事,按照时间线完成。
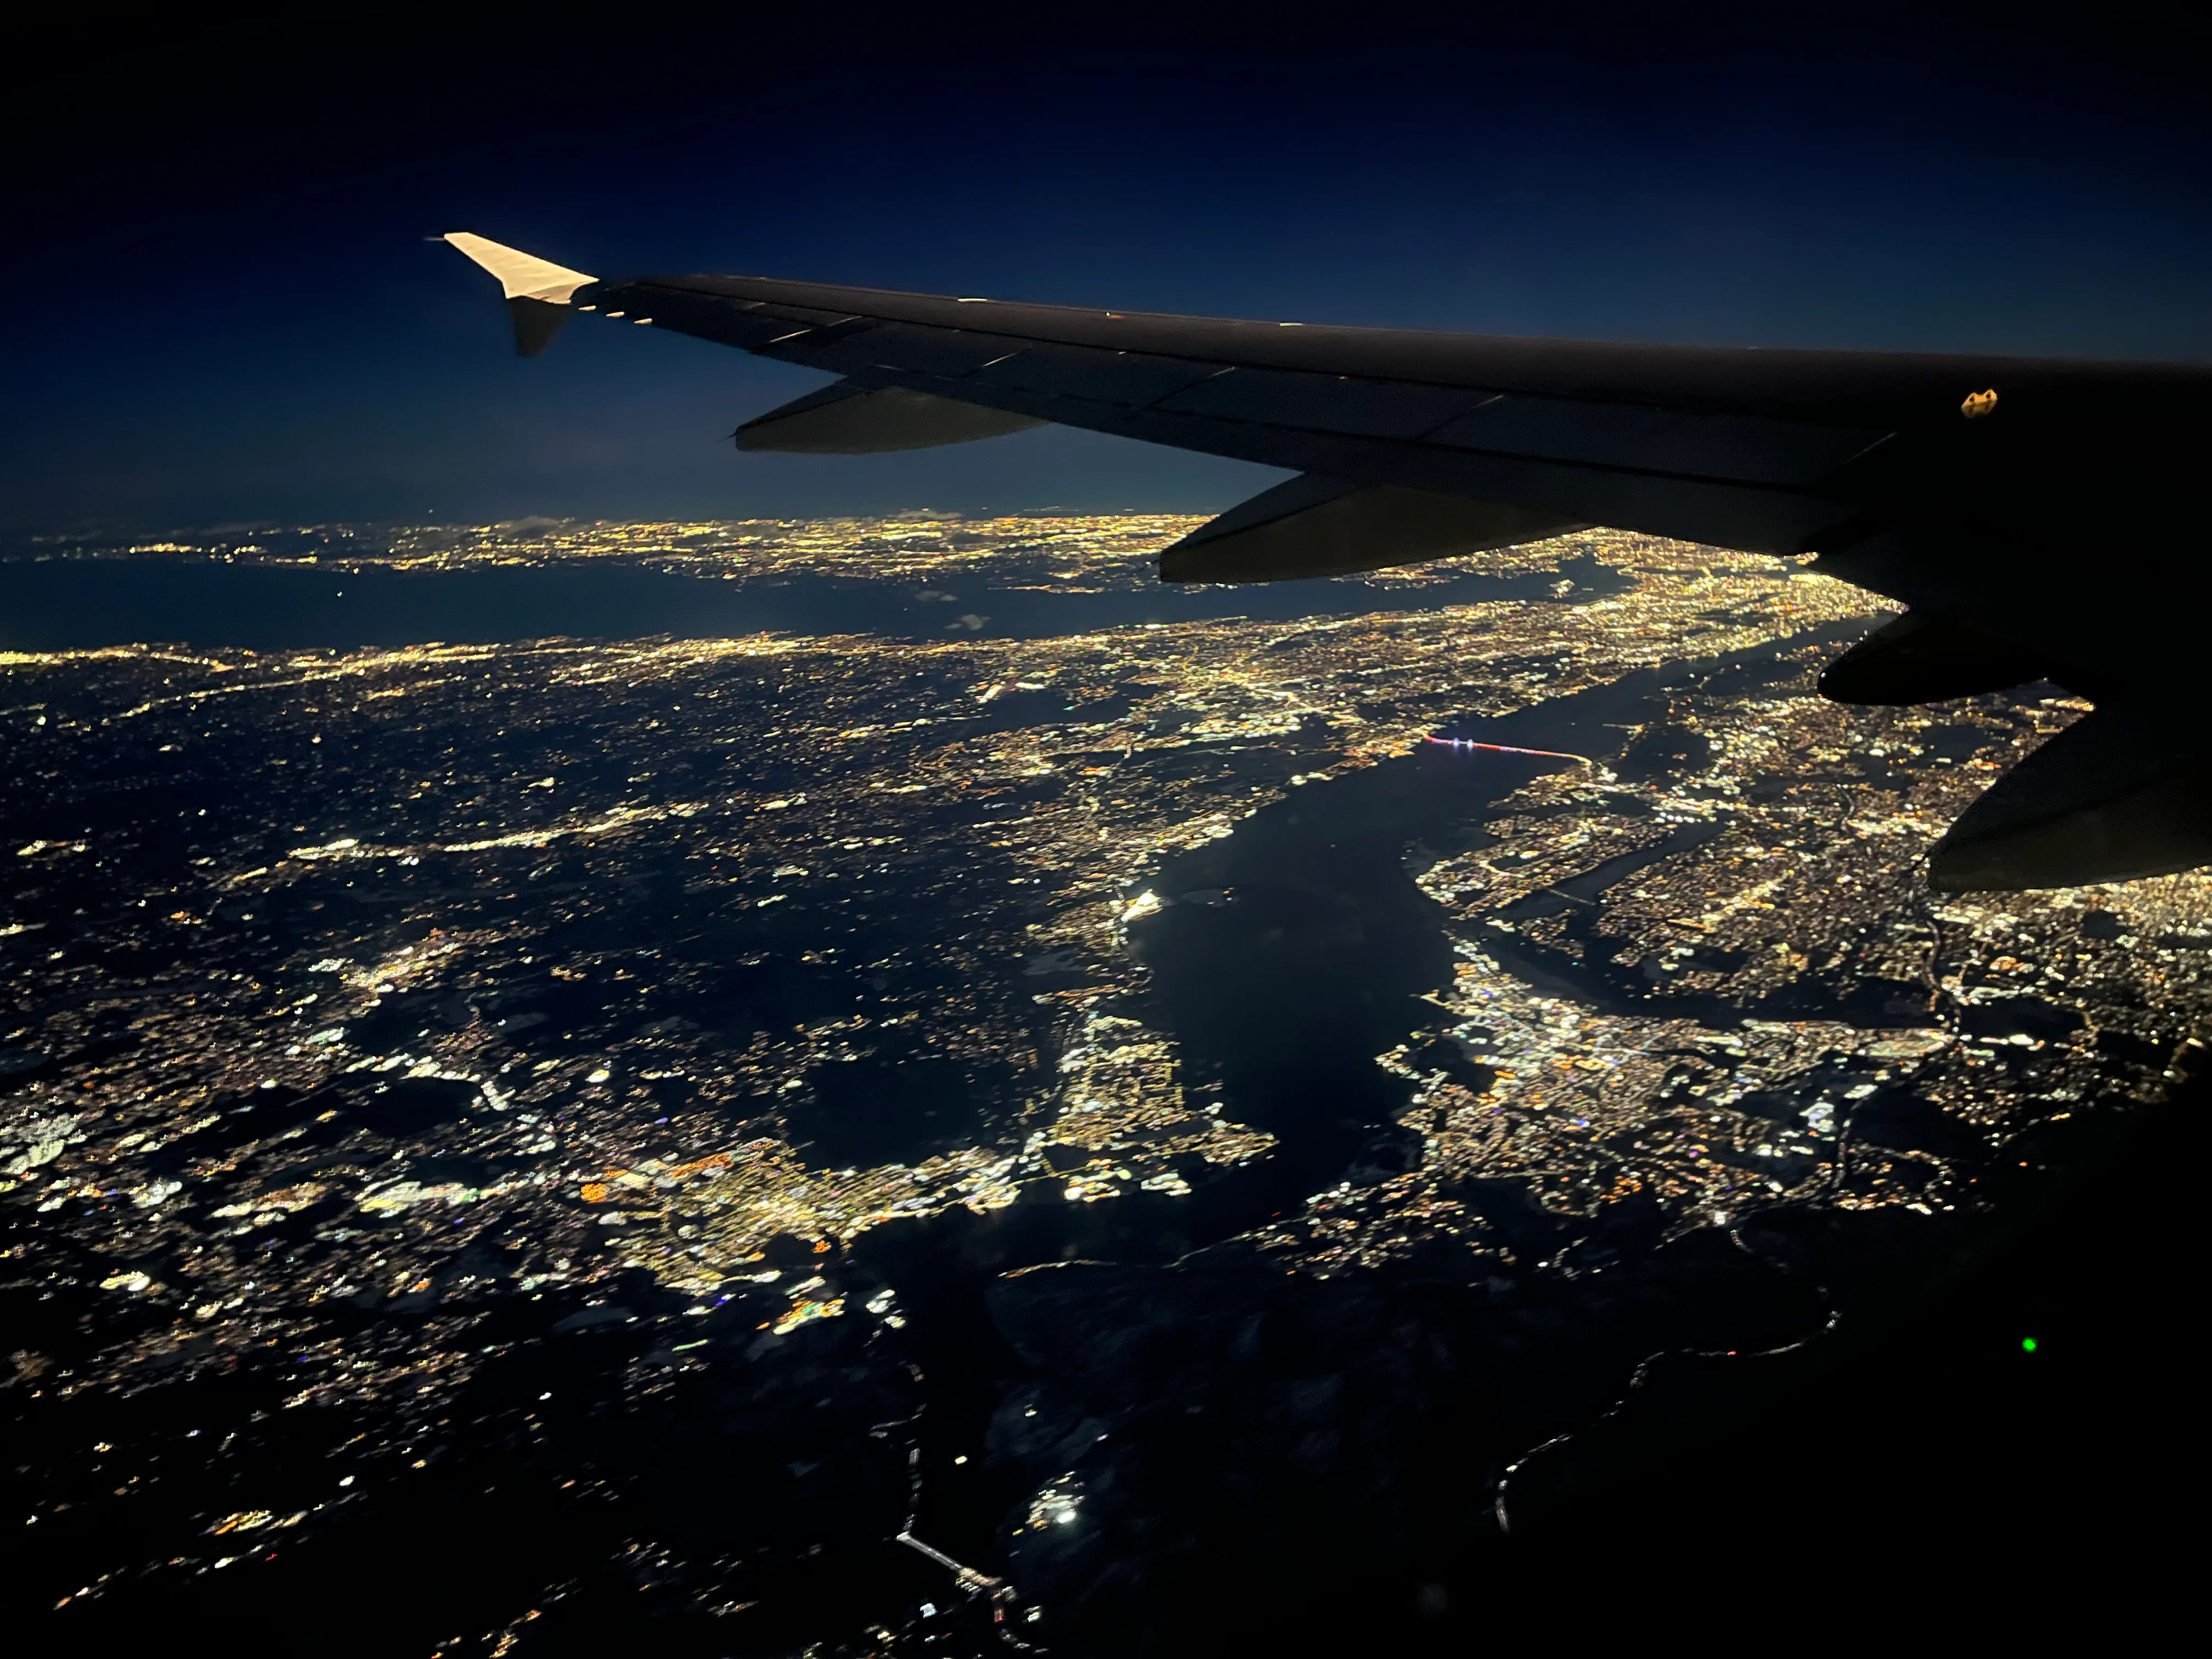
我们用99%的时间在1%的土地上创造了灿烂的文明,却也因此与这颗星球的其余部分渐行渐远。我们修建更高的楼宇、更快的道路,却越来越难以走出那个自我构建的牢笼。
12 Jan 2026
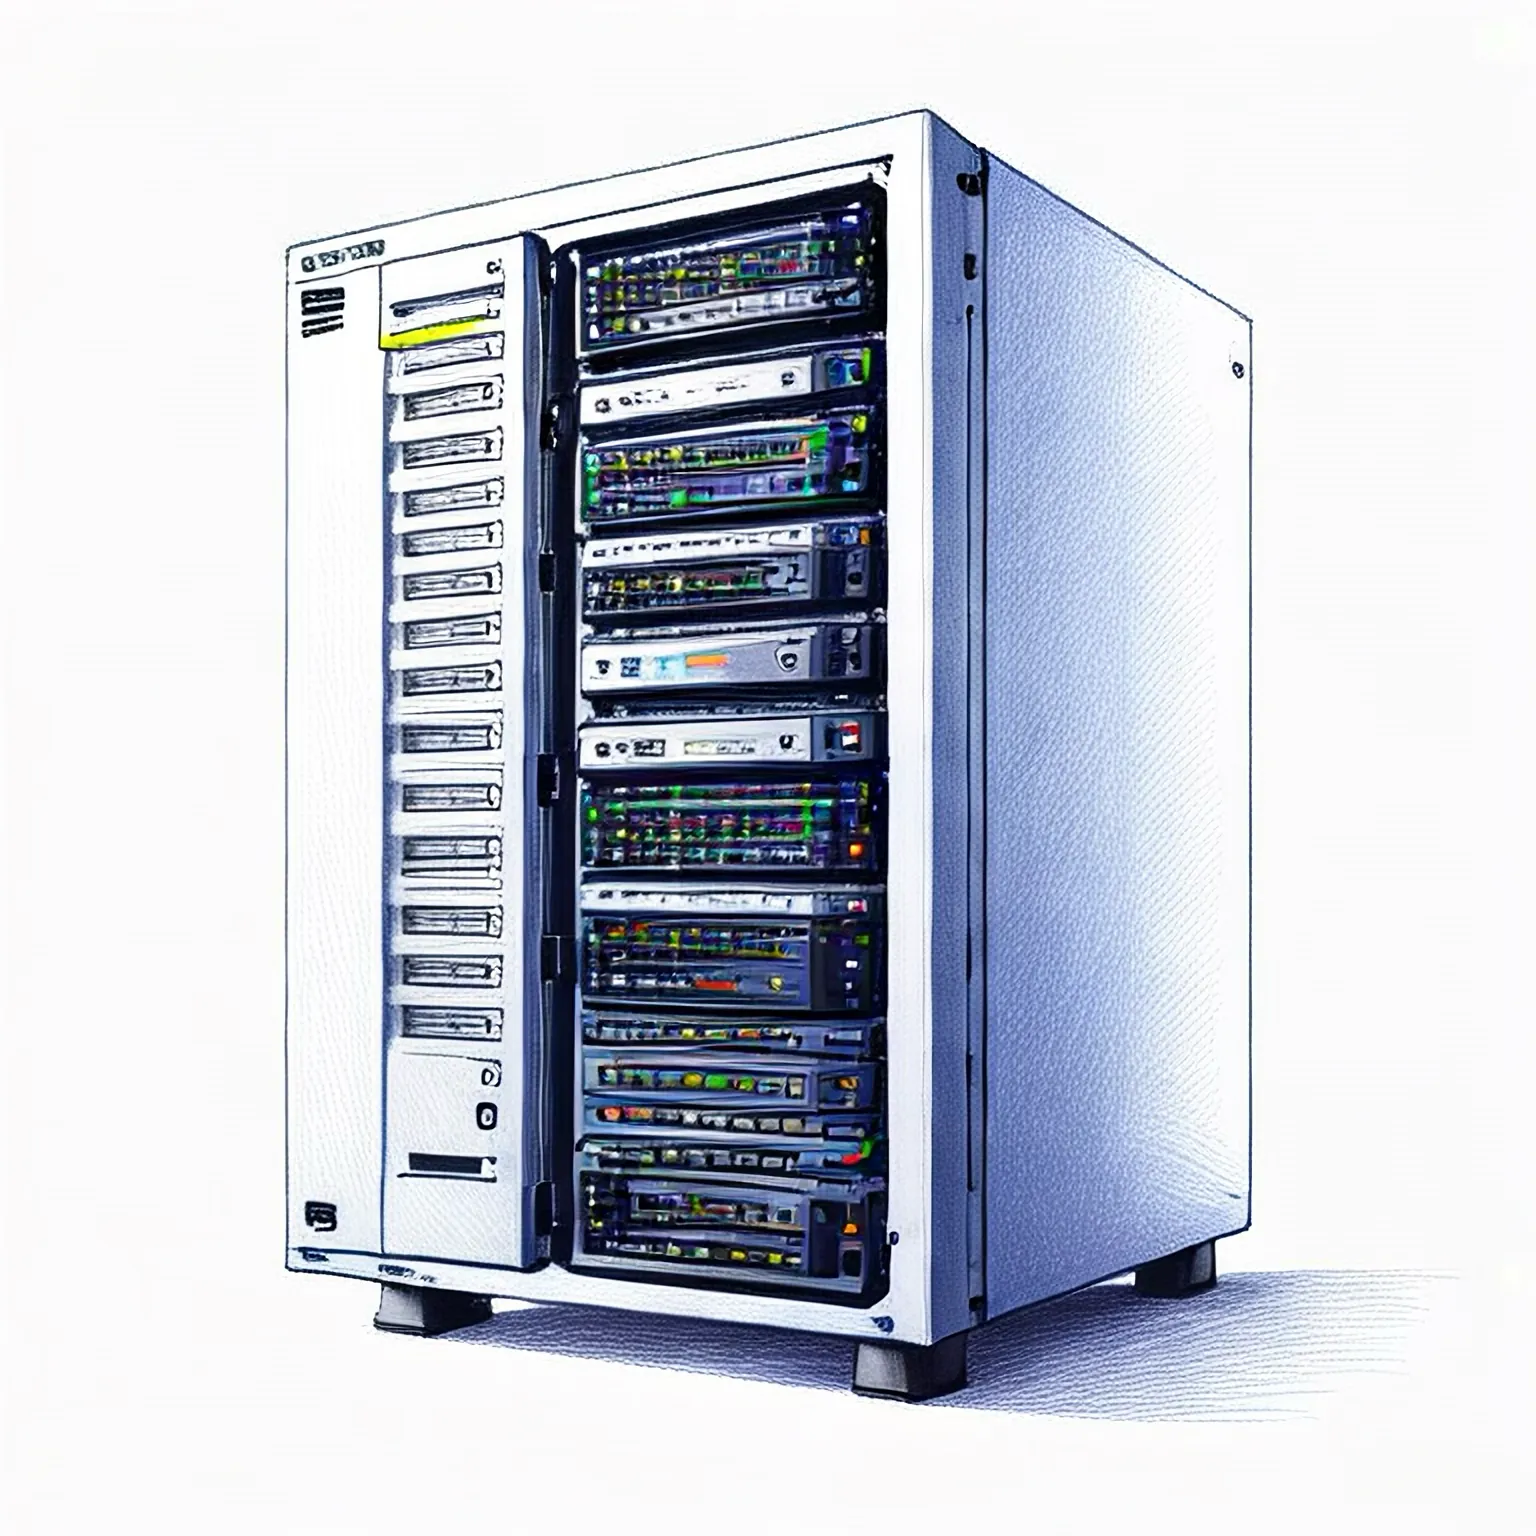
A collection of memos on CSCI 4210 Operating System
30 May 2023
Quantum computing Ph.D. student at CUHK. Ham callsign KD2TAI. Private pilot. // 香港中文大学,量子计算博士生。业余无线电呼号KD2TAI,私照飞行员。
Use the buttons below for my resume & email.